Dashboard
There is a dashboard available in the top left menu. The purpose of this one is to collect statistics of cases/institutes/variants in scout. The default is to show information for the whole instance. A user can also see specific information for the institute/institutes that they can access. We will here describe in more detail what the numbers mean.
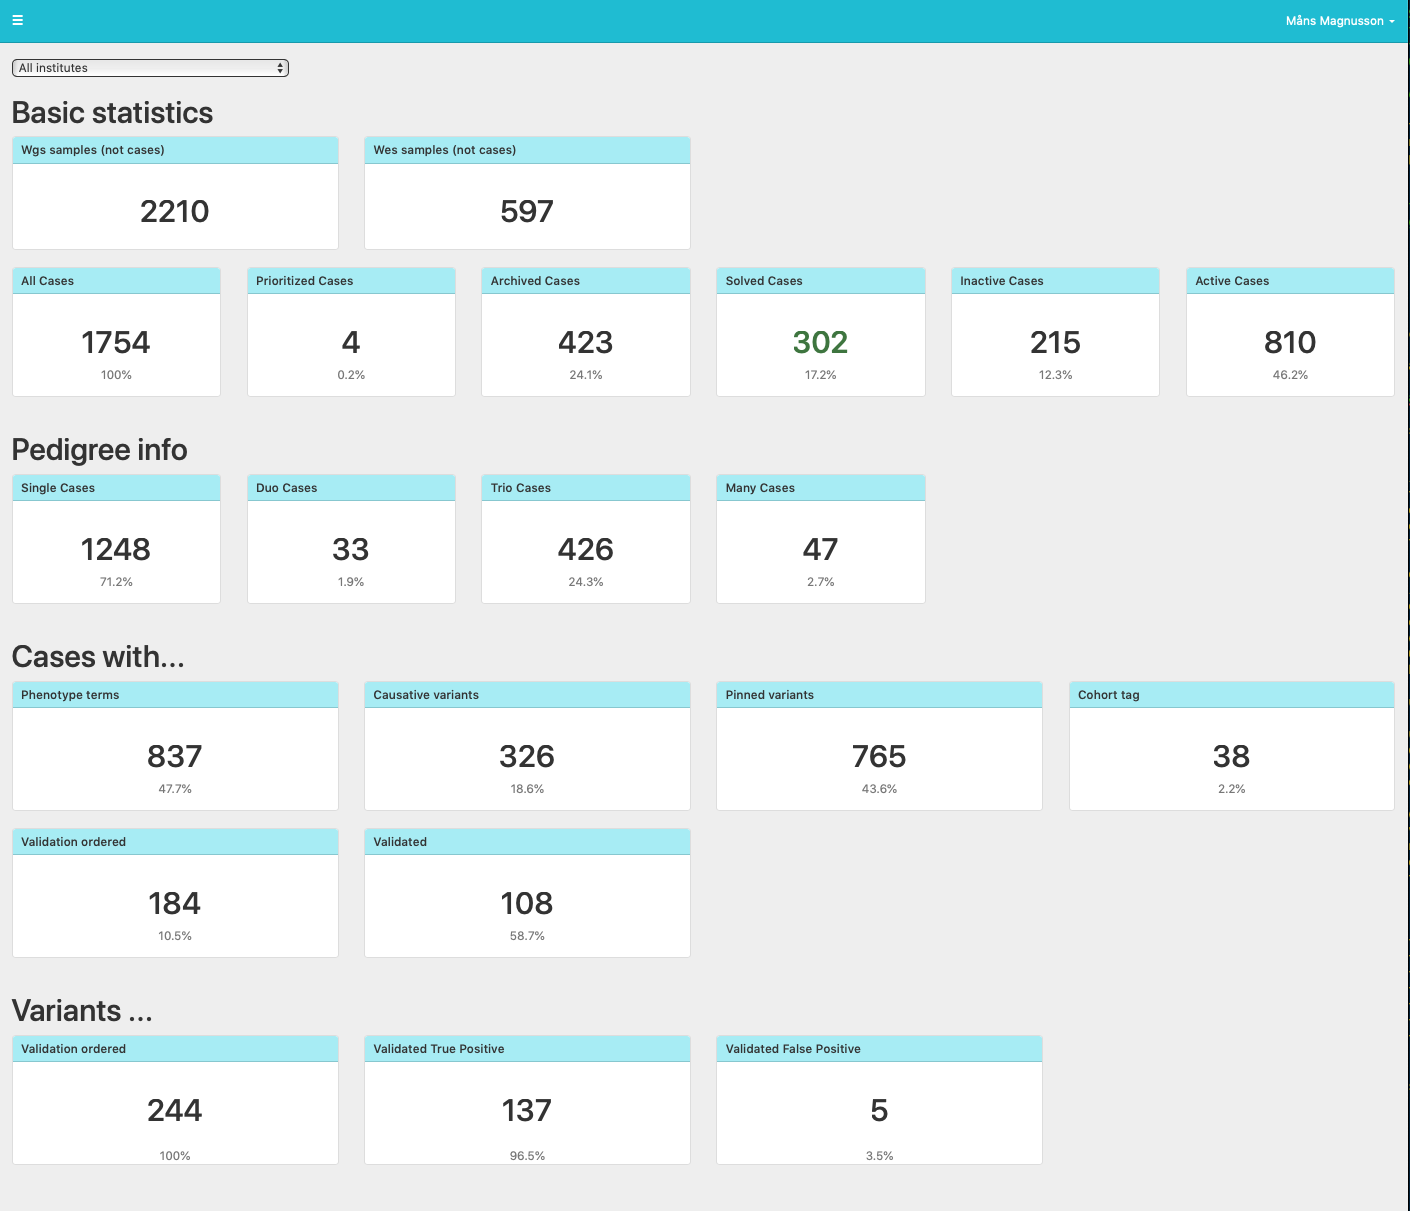
Basic statistics
Wgs samples
The number of samples in all cases that have the analysis tag WGS (Whole Genome Sequencing). Note that there will probably be more samples than cases.
Wes samples
The number of samples in all cases that have the analysis tag WES (Whole Exome Sequencing).
All cases
Total number of cases in database
Tagged cases
The rest of the boxes shows how many cases there are with the different statuses and fraction of all. E.g. if all cases = 100 and 10 are archived the fraction will be 10%
Pedigree information
Displays how many cases that there are of different family sizes. Everything with more than 3 individuals is grouped into the 'Many' category.
Cases with...
Some more detailed information about cases.
Phenotype terms
Number of cases that have at least one phenotype term
Similar for the following.
Variants
Validation ordered
Number of variants with validation ordered. This number could be higher that Cases with validation ordered since one case could have multiple variants where validation is ordered.
Validated True Positive
Number of variants that are validated True positive. Fraction is #True positive/(#True positive + #False positive)
Validated False Positive
Similar to the above